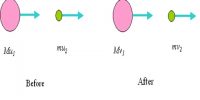
Let a wire be suspended from a rigid support. At the free end. a weight hanger is provided on which weights could be added to study the behaviour of the wire under different load conditions. The extension of the wire is suitably measured and a stress-strain graph is plotted as in Figure.
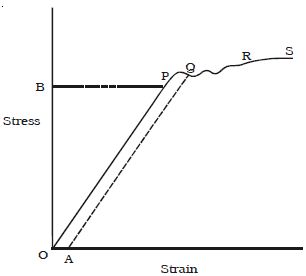
(i) In the figure the region OP is linear. Within a normal stress, the strain is proportional to the applied stress. This is Hooke’s law. Up to P. when the load is removed the wire regains its original length along PO. The point P represents the elastic limit, PO represents the elastic range of the material and OB is the elastic strength.
(ii) Beyond P, the graph is not linear. In the region PQ, the material is partly elastic and partly plastic. From Q. if we start decreasing the load, the graph does not come to 0 via P but traces a straight line QA. Thus a permanent strain OA is caused in the wire. This is called permanent set.
(iii) Beyond Q addition of even, a very small load causes enormous strain. This point Q is called the yield point. The region QR is the plastic range.
(iv) Beyond R, the wire loses its shape and becomes thinner and thinner in diameter and ultimately breaks, say at S. Therefore S is the breaking point. The stress corresponding to S is called breaking stress.