The Polarograph
The potential at which the deposition of metal ions on the cathode starts is known as the deposition potential or discharge potential. The deposition potentials of different metals are different. A plot of current density versus applied voltage for deposition of metal ions looks like the curve in Figure.
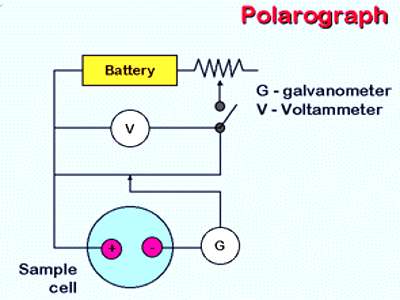
Figure: A typical polarogram
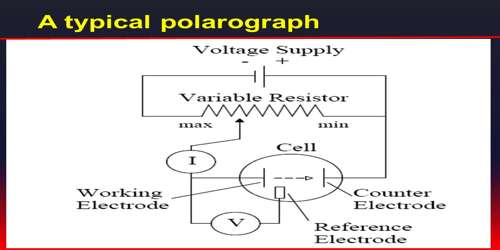
The difference in the deposition potential of metals has been used for analysis by electrolysis in an instrument called the polarograph, devised by Heyrovsky and Shikata (1924). It is called the polarograph as it automatically records the plot of current versus voltage. The instrument consists of two electrodes, one of which is made up of mercury falling drop wise from a fine bore capillary glass tube. The other electrode is a pool of mercury at the bottom of the cell. The mercury dropping from the capillary tube presents a flesh surface. In studying reduction phenomena the dropping mercury electrode is made the cathode and the mercury pool the anode.
Sometimes a reference electrode is used as the anode. In an experiment the applied potential is gradually increased and the current flowing through the cell is measured. A schematic polarogram is shown in Figure. At a certain voltage one of the components on the solution is deposited on the cathode and this is indicated by the sharp rise in the current. The rise is not indefinite, but after a while the current levels off. The leveling off of the current is due to concentration polarization. This current is called the diffusion current as it depends on the rate at which the reducible ions reached the mercury drops. When the voltage reaches the deposition potential of a second component there is again a sharp rise in the current. The rise from a flat portion of the curve to the next is known as the polarographic wave.
The potential at the midpoint of the wave called the half-wave potential is characteristic of the substance being reduced and is independent of the concentration of the reducible species. Observation of the half-wave potentials and comparison with standard tables of half-wave potential enables one to identify the reducible species in solution.