In a chemical reaction the concentration of a reagent [A] is found to decrease with time t as it is consumed to form products. A student measured the data below in the teaching lab.
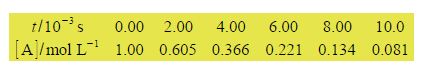
The rate of a chemical reaction v is related to the differential change in concentration with time, in this reaction as below.
v = – {d[A] / d t}
where the minus sign is to convert the negative slope (it is a decrease in reactant with time) into a positive rate of reaction. Firstly, draw a graph of [A] against time. Secondly, draw tangents to the graph and find values for the rate of reaction at times of t = 0, 2.5 x 10⁻³, 5.0 x 10⁻³ and 7.5 x 10⁻³ s. What conclusion can you draw from these different rates of reaction as a function of time?
Here,
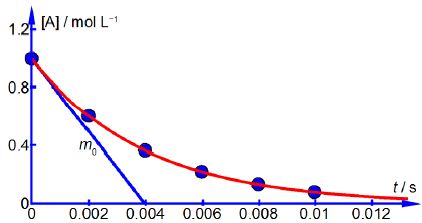
Above Figure shows the reagent concentration against time graph and one of the gradients drawn at zero time which is m0 = -251 mol L-1 s-1. As the rate of a chemical reaction is defined as always positive this gives the rate, v, at t = 0 as v0 = 251 mol L-1 s-1 followings rates. Drawing similar gradients to the smooth curve gives the
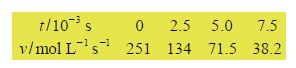
The data shows that the rate of reaction, v, decreases with time because the concentration of reactant [A] is decreasing as it is consumed forming the product.