Mass spectrometry
The mass spectrometer was devised by F.W. Aston (1813) and was first applied in the determination of isotopic masses and the relative abundances of isotopes. Later on, the technique has found wide application in the determination of molecular masses of compounds and elucidation of their structures. Mass spectrometry is used in many different fields and is applied to pure samples as well as complex mixtures.
How a mass spectrometer works-
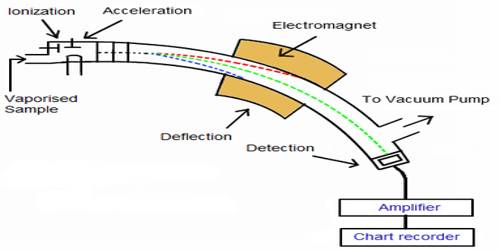
The essential parts of a mass spectrometer are shown in Figure. A gaseous sample (a liquid or solid is vaporized) of the substance under investigation is introduced into an ionization chamber where low pressure is maintained., Here the sample is bombarded with high energy electrons when electrons are knocked out of the sample panicles forming positively charged ions. These are mainly singly charged ions, although ions with more than one charge may be formed. If molecules are bombarded with very high energy electrons the molecules may break up into atoms or groups of atoms with +ve charge which may be described as fragments of the molecules.
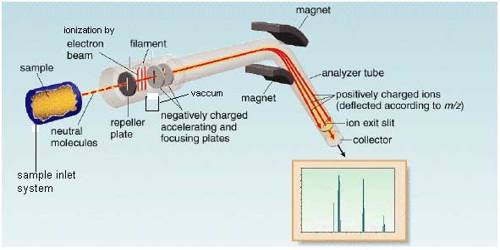
Figure: Diagram showing the essential parts of a mass spectrometer
The positively charged ions are then accelerated by the application of a negative electric field towards a curved tube where it is subjected to a strong magnetic field. The magnetic field deflects the positively charged particles according to their mass to charge ratio (m/z+), particles with lower m/c+ value being deflected more than particles with higher m/z+ value. The particles then fall on a detector where the intensity of the ion beam is detected electrically, amplified, and recorded as peaks at the various m/z+ ratios. Particles with different m/z+ ratios are brought to focus on the detector by gradually changing the strength of the magnetic field. Since the number of charge ‘z’ on each ion is usually I, the value of m/z+ for each ion is simply its mass ‘m’.
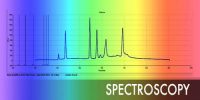
The mass spectrum of a substance is usually presented as a stick diagram with m/z+ values on the x-axis and the intensity (number of ions of a particular m/z+ value) or relative abundance on the y-axis.