An income statement shows the profit or loss generated by a business over a specific period of time. This is usually the most closely examined of the financial statements, since it reveals the operating performance of an entity.
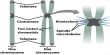
From top to bottom, the template for an income statement is comprised of a header block, a revenue section, a cost of goods sold section, a general and administrative expenses section, and an other income and profit or loss section. From left to right, the template includes description line items, followed by a column containing the period totals for the account aggregations that comprise each line item.
The descriptions of the line items commonly found in the income statement are as follows:
Header Block
- Name of the reporting entity. This is the legal name of the reporting entity, such as “ABC International, Inc.”
- Identification of the income statement. This is a report designation, which is “Income Statement”.
- Reporting period of the income statement. This is the date range for which revenues and expenses are being reported, such as “for the Year Ended December 31, 20X4”.
Revenue Section
- Gross sales. This is the total amount of recognized sales in the period, most of which is likely to come from invoiced amounts or direct cash receipts.
- Sales returns and allowances. This is the amount of returns received back from customers, as well as allowances given to customers to reduce the total amounts paid. This is essentially a deduction from gross sales.
- Net sales. This is a calculation, which is gross sales minus the sales returns and allowances line item. The revenue performance of a firm is usually based on this number, not the gross sales figure.
Cost of Goods Sold Section
- Cost of goods sold. This is the total of all direct materials, direct labor, and factory overhead costs consumed during the period. The amount is linked to the number of units sold to customers during the period. If produced units are not sold, then there is no expense; instead, the related cost appears in the balance sheet as an inventory asset.
- Gross margin. This is a calculation, which is net sales minus the cost of goods sold. It represents the amount of residual earnings left to pay for general and administrative expenses.
General and Administrative Expenses Section
- Advertising expense. This is the recognized cost of all advertising expenditures during the reporting period. In some cases, these expenditures can be recorded as assets and stored for a short time on the balance sheet.
- Benefits expense. This is the cost of all types of employee benefits, including medical insurance, dental insurance, life insurance, and short-term disability insurance.
- Compensation expense. This is the cost of all wages and salaries incurred during the period, as well as bonus and other compensation costs.
- Depreciation expense. The is the periodic charge for the depreciation of fixed assets. This is a non-cash expense.
- Payroll taxes expense. This is the cost of the taxes associated with wages and salaries, such as the employer-paid portion of social security taxes.
- Rent expense. This is the rental cost of the facilities that a business occupies.
- Utilities expense. This is the cost of all heating, air conditioning, electrical, Internet, and telephone service.
Other Income and Profit or Loss Section
- Operating profit. This is a calculation, which is the gross margin minus all general and administrative expenses. This figure is commonly reviewed to see the results of core operations before the impact of financing activities.
- Interest income and expense. This is the interest expense associated with borrowing activities, plus the interest income from investing activities.
- Gain or loss from the sale of assets. This is the residual gain or loss resulting from the sale of company assets.
- Before-tax profit or loss. This is a calculation, which is the operating profit minus interest income and expense, as well as the gain or loss from the sale of assets. This figure essentially adds the impact of financing activities to the operating profit.
- Income tax. This is the calculated amount of income tax owed, based on the taxable pre-tax income figure.
- After-tax profit or loss. This is a calculation, which is the before-tax profit or loss, minus the income tax figure in the preceding line item. This line item reveals the total profit or loss, net of all types of activities listed on the income statement.
The number and description of the line items included in this template can vary substantially, depending on the nature of a business. For example, the types of expenses reported by a services business will vary greatly from those reported by a retail store, restaurant, car distributorship, or shipping company.