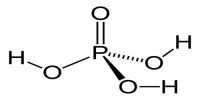
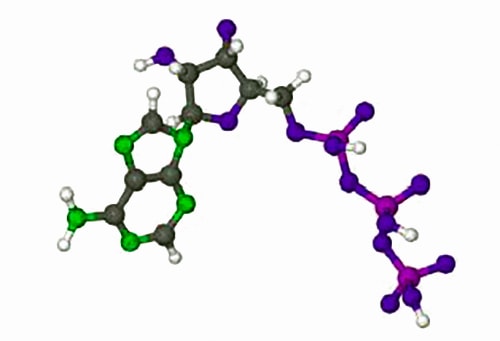
The rates of enzyme reactions literally determine our health and well-being, it is extremely important both personally and industrially (the pharmaceutical industry). Adenosine triphosphate (ATP) is used by all cell to transfer energy which is accessed by hydrolysis with myosin. Below Figure shows the molecule ATP.
For a constant enzyme concentration, the rates of many enzyme reactions follow the Michaelis-Menten equation,
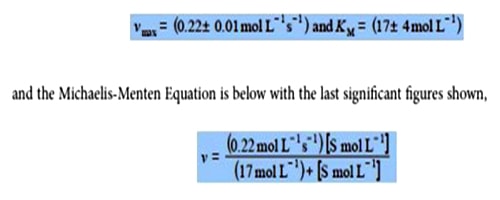
v= (vmax [S]) / (KM+ [S])
where v is the rate of reaction and [S] is the substrate molecules concentration, for this reaction the substrate is ATP. KM is the Michaelis constant, characteristic of the enzyme and substrate combination.
At large concentrations of substrate when [S] = KM then the denominator (KM + [S]) = [S] and so the rate plateaus off to v ≈ vmax When When v = vmax/2 then KM = [S]1/2 with [S]1/2 being the substrate concentration corresponding to vmax/2. The Michaelis-Menten equation is a nonlinear equation but may be rearranged into a double reciprocal form called the Lineweaver-Burk equation.
1/v = 1/vmax + KM/vM[S]
Plotting 1/v against 1/[S] gives a straight line graph called the Lineweaver-Burk plot. This transformed linear equation is very useful in distinguishing different types of enzyme inhibition. However, transforming the equation into a linear form distorts the structure of the data and the relative errors as it is strongly biased in fitting the data at low values of [S] and low v which are the least precise part of the data set with the largest relative error, it is inferior to an NLLSQ fitting. Below Figure is the data obtained by a student using a constant myosin enzyme concentration for the hydrolysis of ATP at 25°C and pH = 7.0. The [ATP]/ 10-5 mol and v/10-6 mol L-1 s-1 however they are shown as [ATP] and v for clarity in the spreadsheet.
| A | B | |
| 1 | [ATP] | v |
| 2 | 7.5 | 0.06 |
| 3 | 12.5 | 0.10 |
| 4 | 25 | 0.13 |
| 5 | 32.5 | 0.15 |
| 6 | 50 | 0.16 |
| 7 | 75 | 0.18 |
| 8 | 100 | 0.19 |
| 9 | 125 | 0.19 |
| 10 | 150 | 0.20 |
| 11 | 175 | 0.21 |
| 12 | 200 | 0.20 |
| 13 | 225 | 0.21 |
| 14 | 250 | 0.20 |
| 15 | 275 | 0.21 |
| 16 | 300 | 0.21 |
| 17 | 325 | 0.21 |
| 18 | 350 | 0.20 |
Plot the raw data as a Michaelis-Menten equation (v against [S]) and use the fact that the curve goes to vmax at large [S] and when v = vmax/2 then KM = [S]1/2. Use these values to help with the starting values of the two constants. Solve the data by an NLLSQ fitting of the Michaelis-Menten equation and find a measure of the precision of the constants.
Solution
Below Figure shows the enzyme-catalyzed data are plotted, along with a curve which is v = 0.21 [S]/(18 + [S]) with the estimated constants obtained by “eye” but nevertheless the curve is a reasonable initial fit to the data.
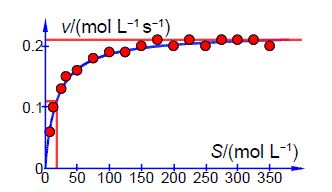
Thus the initial guesses are v. = 0.21 mol L-1 s-1 and KM = 18 mol L-1 and the NLLSQ solved spreadsheet is shown in below Figure.
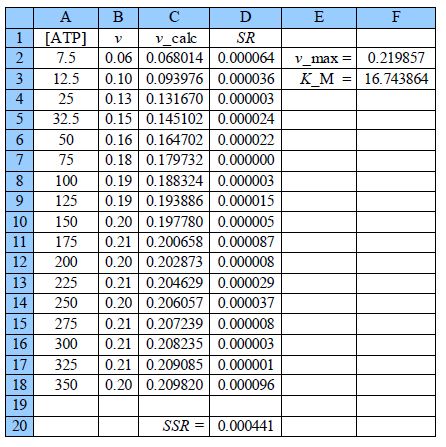
The worth of the approximate graph of the data is shown when the vmax and KM are made unity the SSR is 10.95. However, when are estimates from the above Figure are typed in (vmax = 0.21 and KM = 18) then SSR = 0.0021. Using the DEPS algorithm and editing the cycle limit to 2,000,000 and stagnation limit to 70,000 Solver reaches stagnation after 14.7 seconds with 1088 iterations and SSR = 0.000441.
The NLLSQ fitted plot is in the below figure: